

Support volume grows with every customer; headcount cannot grow at the same rate forever. The way out is a sequence — three months, three layers, each one measured before the next is added.
The 90-day sequence
- Days 1–30: AI triage — classify, prioritize and route everything (see Customer Support Triage with AI: SLA-Friendly Routing)
- Days 31–60: deflection — a grounded help assistant answering the top twenty questions on RAG (RAG in Plain English: Grounding AI in Your Business Data)
- Days 61–90: automation — refunds, status checks and bookings handled end-to-end with human escalation
What success looks like
By day 90: first-response time in minutes, containment above sixty percent on routine tickets, and your team working the conversations that actually need a human. Every number feeds the weekly scorecard from Measuring Automation ROI: The Metrics That Matter — no vanity metrics.
We run this plan as a fixed-scope quarterly engagement with weekly demos throughout. Slots open monthly — Contact to reserve a discovery call.
The landscape in numbers
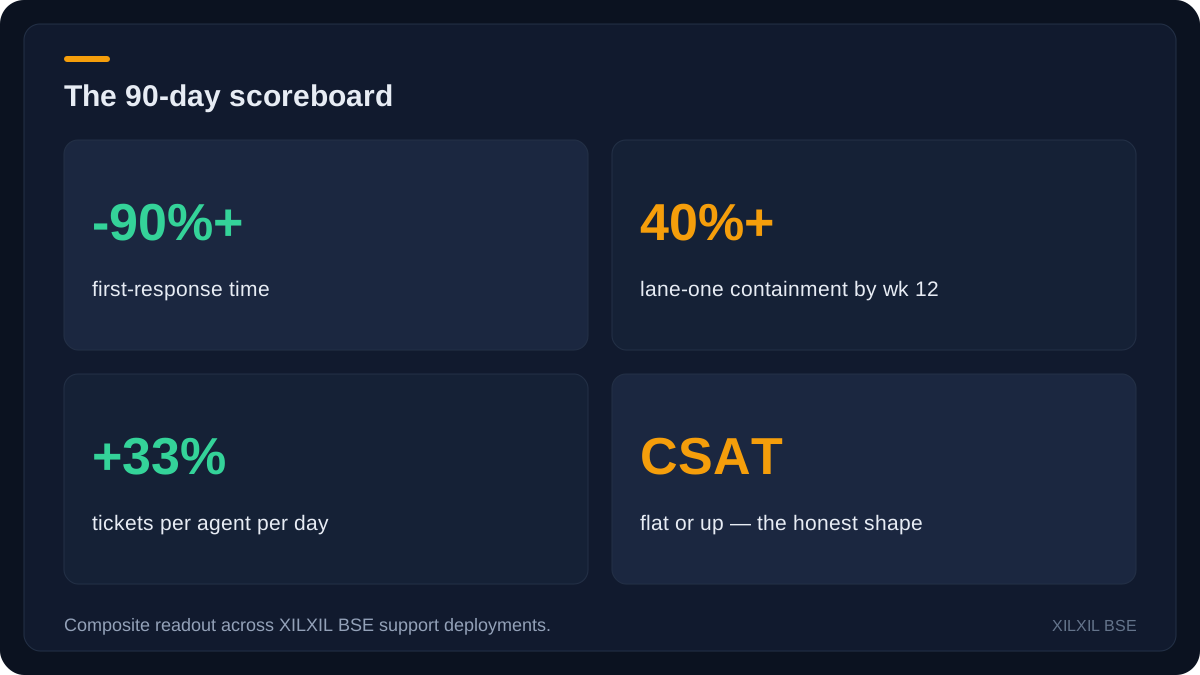
The panel below condenses support scaling into the figures that actually move decisions — the same ones we put on client dashboards. Every value here is a clearly-labelled illustrative industry figure; the operative numbers for your business come from the baseline we instrument before any build starts (Measuring Automation ROI: The Metrics That Matter explains that discipline).
The 90-day arc
Days 1-30: instrument and triage. Every ticket classified, response times baselined, the three-lane desk switched on with conservative automation. Nothing dramatic — the month produces the measurement layer every later decision stands on, plus the first visible win: first-response time collapsing.
Days 31-60: the containment push. Lane-one answers expand across the top intents, drafts reach lane two quality, and the weekly review tunes escalation rules against real transcripts. Days 61-90: scale and prove. Volume grows (it always does), headcount does not, and the dashboard shows tickets-per-agent rising while CSAT holds.
What the dashboard showed
The composite 90-day readout across recent deployments: first-response time down from hours to minutes; lane-one containment climbing to the low forties by week twelve; tickets-per-agent-per-day up by a third with the same headcount; CSAT flat to slightly up — the honest, boring shape of a scaling programme that worked.
The unglamorous hero is the weekly transcript review. Fifteen tickets, tagged and read, produce the tuning backlog that compounds: new intents, tone fixes, escalation thresholds. Ninety days of that loop is the difference between an automation that plateaued at launch and one that got quietly better every week.
What we would do differently
Start the knowledge-base cleanup BEFORE the bot, not after. Half of lane-one underperformance traces to source articles that were stale, contradictory or written for insiders. The bot is honest about what it reads; feed it well or it will reflect your chaos back at customers.
And publish the dashboard to the whole support team from week one, not to managers only. Agents who see containment rise do not fear the automation — they defend it, fix it, and feed it. Support scale is a team sport played on a shared scoreboard.
A rollout that survives contact with reality
Resist the big-bang. The sequence that works for support scaling: weeks one and two, run a small pilot on a single workflow with the old process still running alongside — the side-by-side comparison is the evidence that convinces everyone else. Weeks three and four, integrate with the surrounding systems and let the weekly review tune whatever the pilot exposed. From week six, scale to the rest of the team using the playbook the pilot produced.
Two guardrails keep the rollout honest. First, a named owner with the authority to change the process — automations without owners drift, and drift is how quiet failures start. Second, an explicit success metric agreed before the pilot begins, with the dashboard from Measuring Automation ROI: The Metrics That Matter keeping it visible from day one. With those two in place, scaling becomes a series of small, reversible decisions instead of one large bet.
The 90-day plan at a glance
Three phases, each with an exit criterion — no phase starts until the previous one exits.
| Phase | Focus | Exit criterion |
|---|---|---|
| Days 1-30 | Instrument + triage lanes live | Baseline published, first-response collapsed |
| Days 31-60 | Containment push + weekly tuning | Top intents contained, drafts trusted |
| Days 61-90 | Scale + prove on the dashboard | Volume up, headcount flat, CSAT held |
The data, visualised
Charts beat adjectives. The figures below are drawn from the illustrative dataset behind this article — treat the shapes as the lesson, and replace the placeholder values with your own baseline when the work starts.
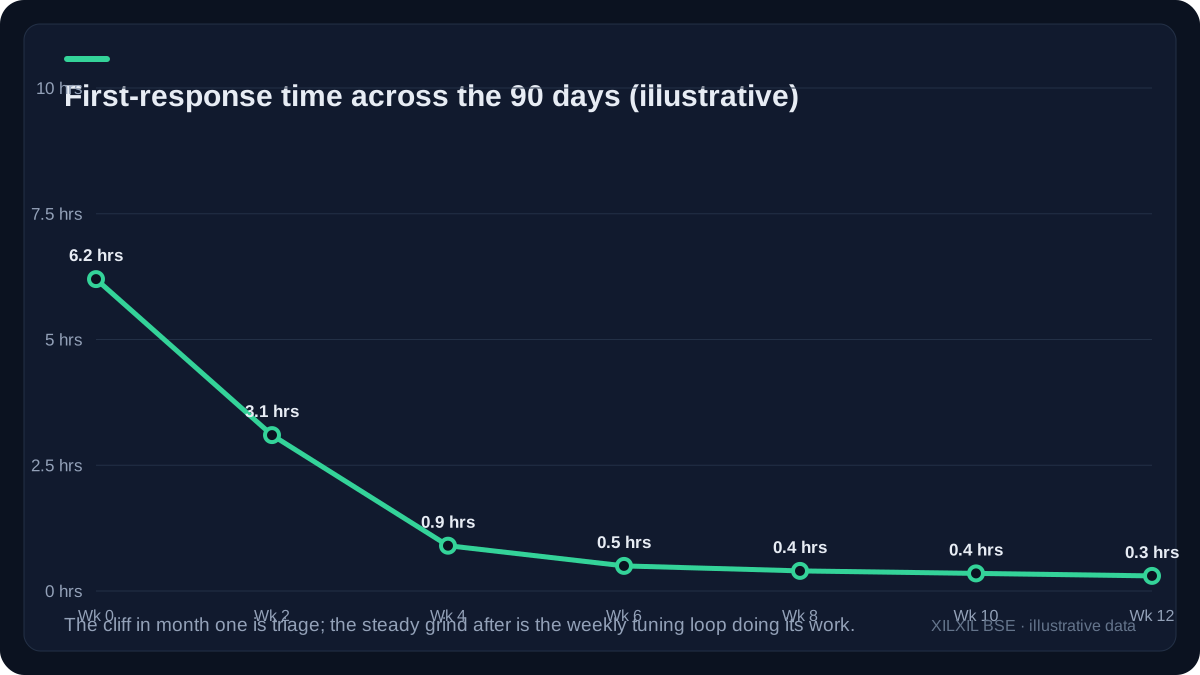

Volume grows — it always does. Headcount does not have to. That gap is the entire business case.
Key takeaways
- Instrument first: no scaling decision survives without a baseline.
- Three lanes with conservative automation beat one ambitious bot.
- The weekly transcript review is the compounding engine — never skip it.
- Clean the knowledge base before the bot reads it.
- Share the scoreboard with the whole team; defenders beat the fearful.
Frequently asked questions
What does it cost to run this arc?
It is the standard fixed-scope support package — Pricing lists it. The 90-day readout is part of the delivery, not an upsell.
Which tools does it integrate with?
Zendesk, Freshdesk, Intercom, WhatsApp Business and shared inboxes. The pattern is tool-agnostic; connectors are project detail.
Do agents lose their jobs?
In every deployment the team kept its people and reallocated them: less copy-paste, more judgement work. Attrition goes DOWN when the drudgery goes — agents stay for the interesting tickets.
What if CSAT dips?
Then the weekly review finds why — tone, containment boundary or a knowledge gap — and tunes it. Dips caught in week three are tuning; dips discovered in the quarterly review are damage.
Conclusion & next steps
That is the full picture: the context, the decisions, and the numbers behind support scaling. If one sentence should survive this read, it is this — preparation compounds. Measure the baseline, make the process legible, then automate deliberately and review monthly; that sequence works for support or CX leads in your helpdesk and everywhere else.
Want the 90-day arc on your desk? Contact to scope it — and Measuring Automation ROI: The Metrics That Matter shows how the payback gets counted.
Picking tools for the job? Our honest, data-backed reviews live at Top AI Tools 2025 (SaaS & AI platforms) and Smart Home Picks (hardware worth the dirham) — illustrative benchmarks, clearly labelled, and never pay-to-play rankings.



3 comments